
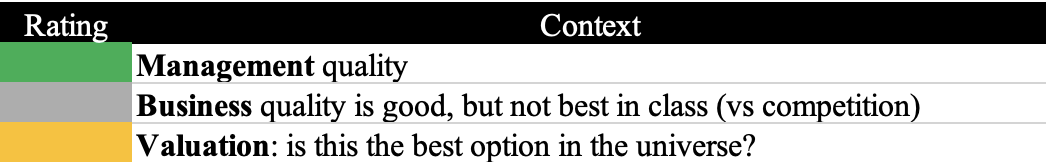
IPO narrative
- Management is TCE-grade (trustworthy, capable, and energetic).
- Sai is a CRDMO, consisting of 66% CDMO (development and manufacturing of NCEs) and 34% CRO (drug discovery research).
- The total capacity of 500 KL appears to be smaller than that of the peer group. Divis, Laurus, Hikal, Solara, and Suven Pharma clearly lead in terms of capacity. Even Neuland has a capacity that is double that of Sai Life.
- Early anecdotal evidence suggests AI/ML is increasing industry-level productivity already. Expect further AI/ML/algorithm traction in the future.
- Sai’s UK and US operations are subscale, impacting profitability and making a quick turnaround unlikely. Wait and watch.
- Largely a small-molecule CDMO with no fermentation, bioscience “at scale” capability. Small-molecule CDMOs with superior valuations are available in the listed space.
- Syngene remains the sole leader in on-patent commercial bio-CDMO space. Others playing catch-up.
- Syngene has best-in-class efficiency ratios (debtor, inventory, cash conversion, working capital, and OCF/EBITDA).
- Because they have their own intellectual property (IP) pertaining to generic process innovation, hybrid CDMOs, which combine both generic and innovator molecules, are less dependent on innovators for their destiny.
Industry Structure
Sai Life operates across the entire CRO-CDMO continuum, offering a one-stop shop to global innovators by partnering with them from the early stage of drug discovery to commercial manufacturing, which is a tail event for any molecule entering the discovery phase. This aligns with the natural process, where millions of sperm initiate the competition, ultimately leading to a single winner. Likewise, millions of early-stage screening candidates enter the discovery space, and the failure rate from that point is a number close to 100%. Only after filing the investigational new drug (IND) does the average probability of success approaches 8%.
For an overview of the pharmaceutical R&D value chain, refer to Appendix A at the end of this report. Drug discovery from target validation to IND works on a ‘fail fast’ model where the ‘winner (IND) takes all.’ However, IND filing is merely the start of what we call the CDMO stage, where the failure rate from Phase 1 to LOA (likelihood of approval) could be as high as 95% for certain drugs (e.g., the urology therapeutic category).

Image source: Framing Business Certainty by Sajal Kapoor
The likelihood of success and failure are synonymous. The failure rate from Phase 2 is no less than 70%; therefore, a company with ten molecules in Phase 2 will most likely have only three move-on to the next step. This is why most CDMOs’ business development, senior management, and technical teams aggressively seek late-phase 3 candidates, as cash flow economics and probability of success increases considerably at that stage. However, success still remains uncertain, with approximately 30% of pipelines failing even at the late Phase 3 stage.
The earlier a drug candidate fails, the lower the cash burn and time (opportunity cost), allowing for the redeployment of scientific resources wasted on that molecule. Today, CDMO industry deploys bioinformatics and artificial intelligence, along with a variety of cutting-edge software models, to improve predictability and promote early-stage failure.
Every time a molecule fails, science provides feedback to the ecosystem, encouraging it to try a different path for future success.
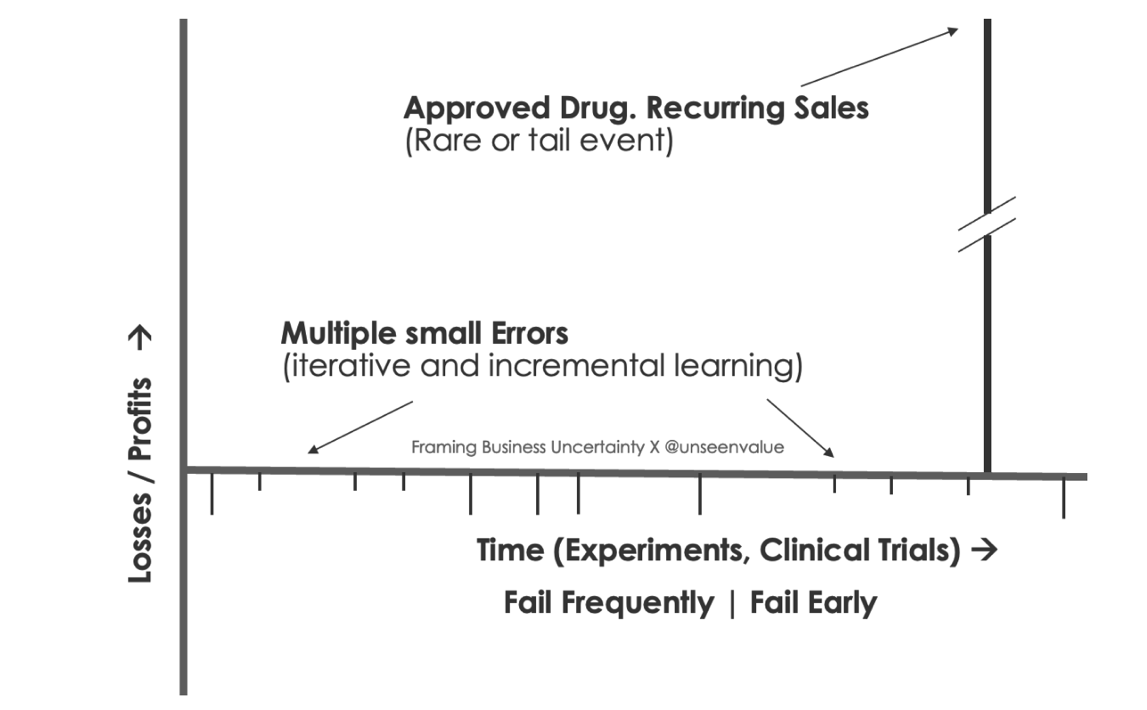
Image source: Framing Business Certainty by Sajal Kapoor
“Failure should be our teacher, not our undertaker. Failure is delay, not defeat. It is a temporary detour, not a dead end. Failure is something we can avoid only by saying nothing, doing nothing, and being nothing.” – Denis Waitley
It is worth noting that this Phase 1 to commercial number (8%) is just an average, and averages are always misleading. The success rate from early Phase 1 to commercial has huge variation depending on the target indication and technology, as highlighted in the image below.
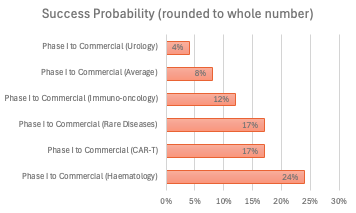
Image source: created by the author using data from BIO data[1]
Uncertainties and challenges
There are five fundamental drivers of uncertainty in the development and synthesis of innovative drugs in the drug discovery and development space.
- Funding and sponsorship challenges
- Infrastructure and supply chain challenges
- Technical or scientific challenges
- Regulatory challenges
- Market response (post-commercial launch)
In addition, there are several other challenges that no sensible management can ignore, such as:
- Shifting geopolitical dynamics could have a positive impact on the Indian ecosystem, thereby benefiting Sai Life as well. Everyone should get a fair slice of this “pizza.”
- Excess Production Capacity and Associated Costs (CDMO is a high fixed cost business, and any unplanned downward curve in sales is a direct negative impact on operating and net margins).
- All CRDMOs require a workforce that is both experienced and skilled.
- Yield maximization, along with impurity elimination, is another ongoing challenge for the industry.
- Continuous technological upgrading is mandatory and never a luxury.
Management
Sai Life’s management and a well-diversified board of directors have a proven track record of execution.
A robust 9-year sales CAGR of 18% (significantly above the overall industry growth). However, the growth in net profits has been slower than the growth in sales, at a rate of 15%. Several factors appear to be contributing to a lower growth in profitability compared to sales.
Over the last decade, a number of variables have contributed to an approximately 30% increase in operational costs.
- Growth into higher-fixed-cost UK and US operations.
- There has been an increase in marketing and business development activities. Medium term negative, but long term positive.
- Higher wastage of raw materials and partially finished goods is often related to increased development and scale-up intensity when compared to commercial operations.
- Frequently, batches produced do not reach the intended purity and yield, resulting in rejection of the entire batch and restarting the synthesis, leading to an unnecessary rise in operating costs. This is normal during scale-up of novel molecules.
There is no single cause that is completely responsible for increased operating costs, but the leadership team must thoroughly examine every business and scientific process in order to create an agile and fit-for-purpose operating system, processes, and controls.
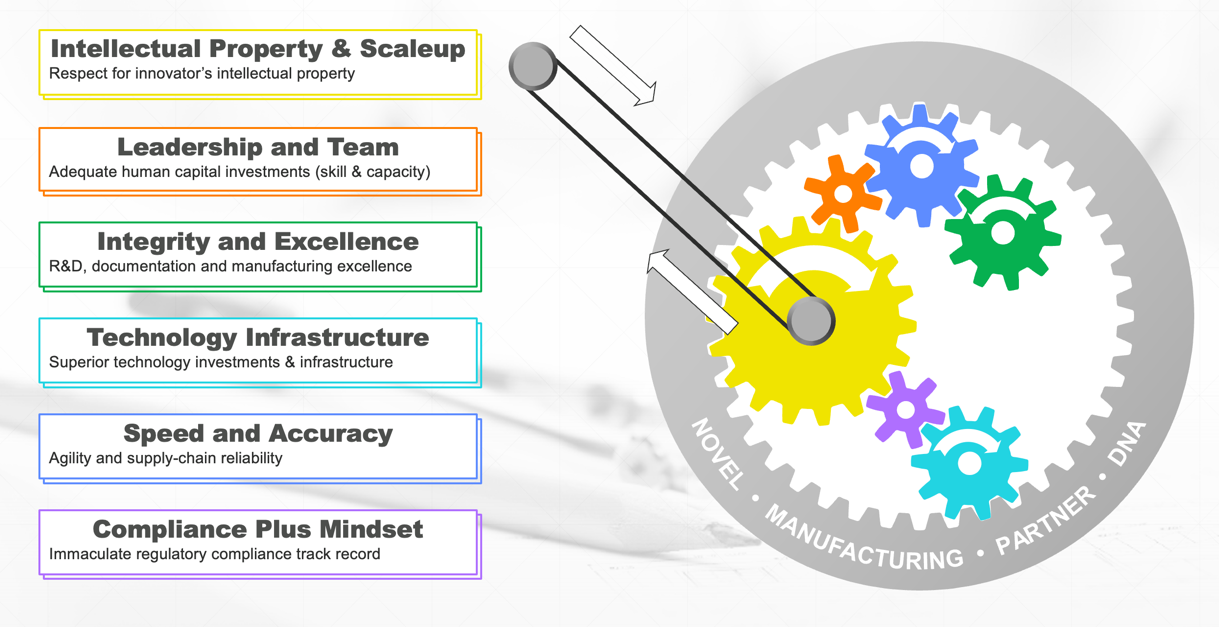
Image source: Createdby the author
The picture above is a reminder of the ‘normal’ or ‘minimum expectations’ that shareholders and customers bestow upon any competent and trustworthy leadership team. However, periods of extreme uncertainty expose the leadership team’s character and conduct, and fortunately, we are currently in a period where geopolitics and supply chain shifts are occurring at an unprecedented pace. From my perspective, the following data points will be used to track this management over the next three years:
They must aim to significantly enhance the economics of our US operations, ensuring that the return on capital (ROC) comfortably surpasses the cost of capital (COC), thereby generating free cash. This will make US operations self-sustaining, and the parent entity can reinvest all the free cash into building capability and capacity.
Fermentation and biosciences are important future domains. How soon can Sai develop commercial scale competence in this domain?
Another area to measure the effectiveness and governance of Sai’s leadership would be operational efficiencies and reducing the gap between high gross margins but lower EBITDA margins, given the fact that Sai’s entire operations are geared towards on-patent development and manufacturing where margins and asset turns are much better (Anthem Bio being a case in point with comparable gross margins but 45% EBITDA).
India has had a rich heritage of chemists and technologists over the decades, but historically Indian companies have reverse-engineered patented molecules and filed non-infringing drug synthesis processes to capture the off-patent market. Creating something that doesn’t exist today requires a very different (creative) mindset, akin to Peter Thiel’s zero to one. Sai’s senior leadership team will face challenges in attracting and retaining this “limited edition talent-pool” for drug development and scale-up in India.
While closely tracking the execution capabilities of an unlisted company is always challenging, Sai’s listing will provide investors with regular access to multiple credible data feeds. This will surely help in matching the strong IPO narrative with on-ground execution over the next 3–4 years (I don’t think we can measure the outcome any sooner than that, given the industry workflow and long gestation period).
Average duration of Sai’s relationship with its customers (rounded up to the nearest whole number of years below) bodes well about the past and near-term execution from management. This provides ample opportunities for expanding the customer base through word-of-mouth referrals and enhancing customer satisfaction.
Top customer – 18 years
Top 5 customers – 10 years
Top 10 customers – 11 years
CDMO relationships are sticky, particularly once the molecule reaches late Phase 2 or Phase 3 with positive data readouts and, of course, the commercial pipeline. This creates strong exit barriers, making it difficult for customers to terminate the relationship and for competitors to enter into an existing relationship, unless they are entering as a second source. The famous Bollywood song fits well here— “Bahar se koi andar na aa sake; andar se koi bahar na jaa sake”—May 2022, Alpha Series 25[2]
Business
As a business, I admire the high gross margins that Sai operates at. This is on par with larger competitors such as Syngene, albeit with slightly higher gross margins. In an industry where it’s nearly unfeasible to exceed 80-85% utilisation (for fungible reactors, because of product and batch linked synthesis process changes), Sai’s reactors already running around 70% of rated capacity. Unless some bottlenecking is possible, there is a risk that Sai may run out of commercial capacity by the end of FY 26.
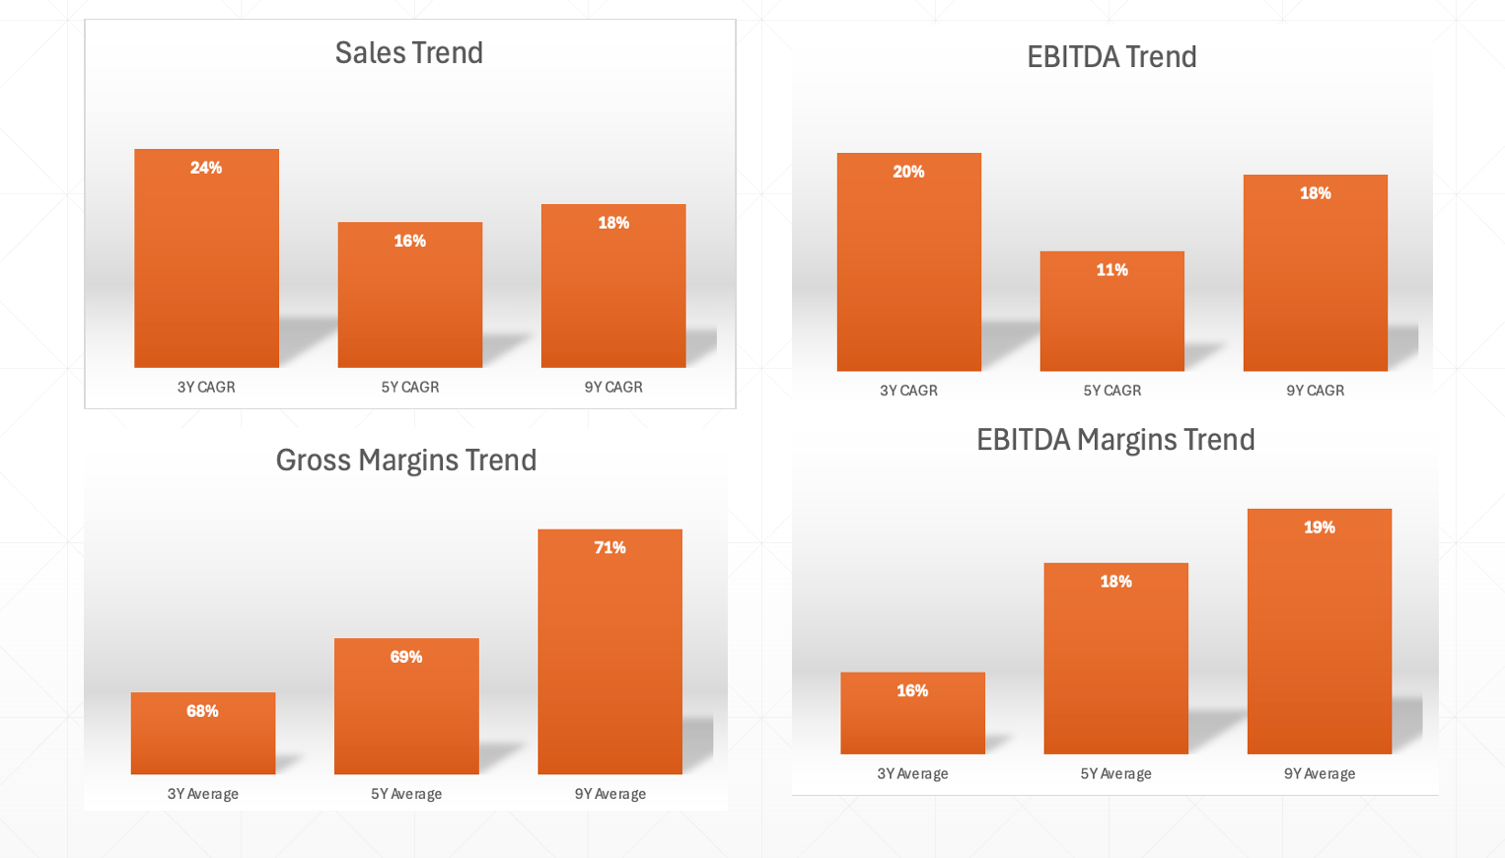
Image source: Createdby the author using DRHP data
Sai Life’s employee costs have increased by 2.5 times between FY 19 and FY 24, while revenue growth has lagged behind, indicating a gestation period in this business. This is consistent with the CDMO sector, where a molecule takes a while to progress through the pipeline, leading to eventual success, unless it dies in flight (which is the common scenario). While the sales fluctuate, the employees and other fixed costs remain constant, resulting in an operating de-leverage. Currently there is serious de-leverage in Laurus Labs, a scenario similar to Neuland Labs in late 2021 and throughout 2022 when their Unit 3 was not optimally utilised.
Operating leverage and de-leverage occur in a cycle, and the best time to acquire these assets is during a downturn (de-leverage with EBITDA margins in the mid-teens, not when margins are near 30%). Note that ‘acquire’ means deploying fresh capital.
There’s no reason to deny that when the EBITDA margins get close to 30%, which is where they should be for strong capabilities that run efficiently (gross margins of 60% or more indicate strong science-based competence), they may start to fluctuate in a narrow band between 25% and 30%. In this case, the stock may continue to rise as long as the core ROCE stays above 20% and sales and EBIT growth stay in the double digits or at least the high single digits over the rolling 3-year cycle.
Every scientist is a unit of growth, and any incremental additions are always non-linear, as the same pool of scientists that work on a molecule that either dies or wins the NDA trophy will get recycled to work on the next best opportunity, leading into a scenario where a company can double sales with almost no proportionate change in the scientific headcount.
“You are absolutely right. So, to grow our CDMO we need to add capacity, not scientific staff more. We need to add some, but not in the same arithmetic proportion,” stated Laurus Labs in July 2023.
The current development and manufacturing capacity of ~500 KL may appear minimal, but it is being used for high-potency, high-margin, low-volume manufacturing and development. Assuming ideal capacity and consistent gross margins, this ~500 KL might generate sales of INR 1500-1800 crore. Add another INR 600-800 from the current scientists’ base for CRO, and we have a situation in which FY 27 revenues could exceed INR 2500 crores. This is my best guess and not a high conviction “guidance”.
Note that Sai’s flagship facility, Bidar Unit 4, has a higher asset turnover rate due to its efficient capacity utilization. The blue-sky scenario is a result of a combination of factors, namely execution capability. Having a great all-around team on paper is one thing but gaining market share against other players who may be as competent, if not better than Sai, is another. Other variables include winning the game against fierce competition, geopolitics, and regulatory scrutiny. The network’s current capacity utilisation is close to 70%. It is worth noting that capacity and competence development is a continuous process in this business.
Sai’s Phase 3 contains ten compounds (I’m not sure if these are RSMs, intermediates or APIs) with an average failure rate of 40–45%, while commercial molecules number 28. Which are the top five? 80% of sales from the top 20 customers is an acceptable projection, in my opinion. That’s the fundamental Pareto principle, sometimes known as the 80:20 rule.
Fish Bone Analysis
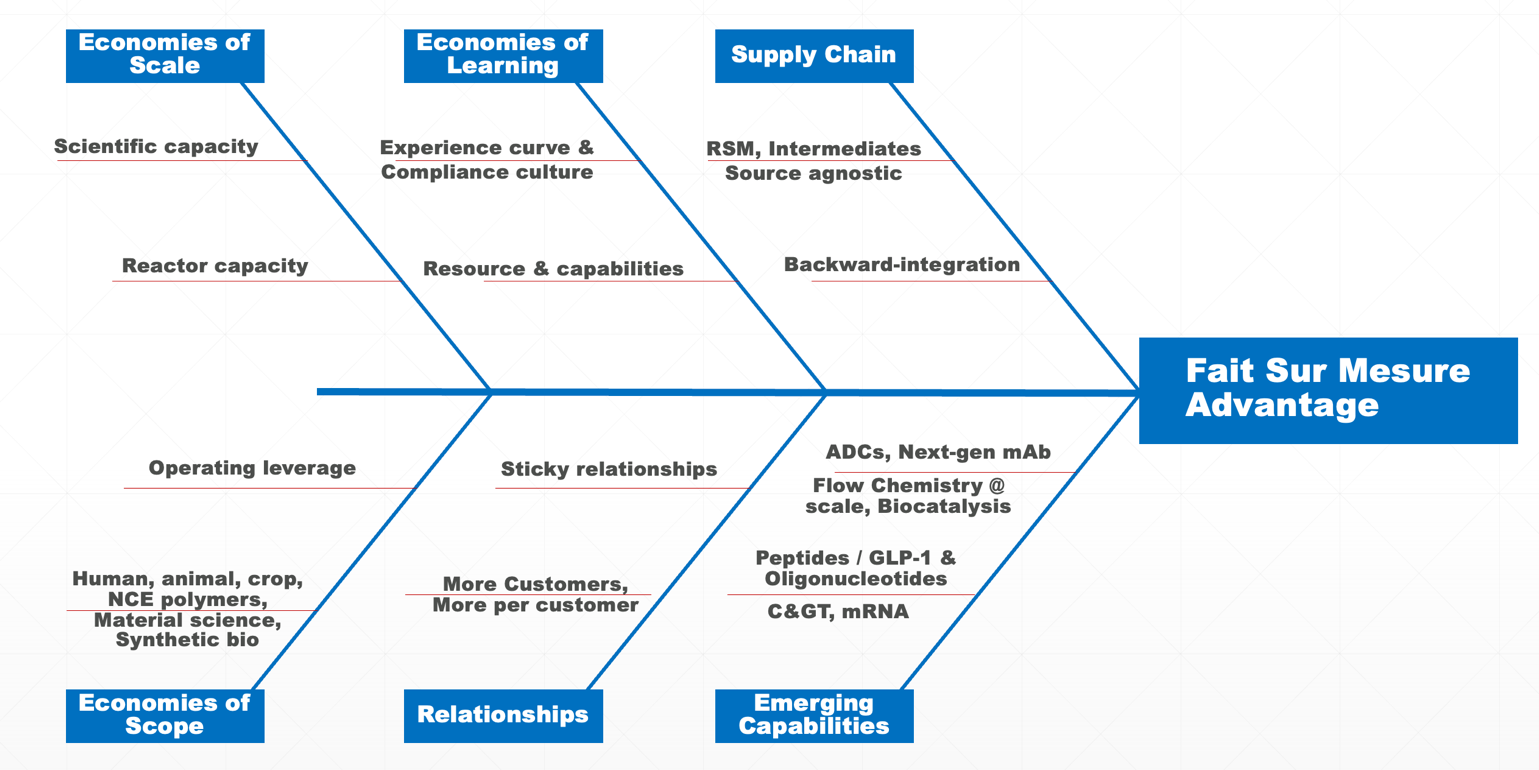
Image source: Createdby the author using DRHP data and own analysis
A “fait sur mesure” competitive advantage contains several distinctive aspects that make it difficult for competitors to imitate an incumbent.
Peer Analysis
CRDMO and CDMO industries are highly fragmented, and yet every company is somewhat different, making it almost impossible to do a like-for-like comparison. Aragen Lifesciences, Syngene, and DCAL (Dishman Carbogen) are innovator-heavy CDMOs that do not use generic manufacturing materials. The leading hybrid CDMOs straddling the innovator and generic space are Divis, Neuland, Laurus, Suven-Cohance, Anthem Bio, Hikal, Solara, Piramal Pharma, and Jubilant Pharmova.
Sai’s global scientist staff increased from 617 as of FY22 to 934 as of FY24. This pales in comparison to Syngene’s 5600 scientists. Laurus boasts more than 1200 scientists, including LaurusBio, and I predict that number will rise to 1500 once the new R&D unit is fully operational. In my opinion, the player who can effectively manage the scale and complexity of juggling across multiple domains such as human, animal, crop, nutraceuticals, cosmeceuticals, and polymers will emerge victorious. Executing at large scale and across the domains is easier said than done, though.
Source: Screener.in
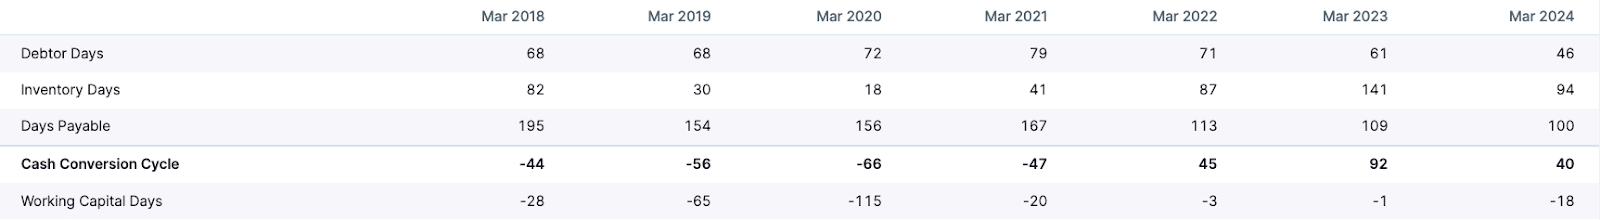
On the comparison metrics of trade receivables, cash conversion cycle (CCC), OCF/EBITDA, data as disclosed in the DRHP, Syngene clearly stands (note that the author is currently invested in Syngene, and biases are therefore natural) out in the entire Indian ecosystem, let alone a comparison with Sai (highlighting strong moats that Syngene has created over the years). Sai’s cumulative OCF/EBITDA from FY 15 to FY 24 stands at 76%, indicating a robust performance. Syngene in comparison runs at around 95% OCF/EBITDA.
In the CDMO industry, there is a trend where H2 performance exceeds H1 in a normal financial year. This data includes almost everyone from Piramal Pharma to Hikal and Laurus. This is partly due to December being a festive month, and innovator customers usually shy away from piling inventory on their annual balance sheet for their financial year ending December. So, I expect Sai and several other players to report significant traction in the remaining two quarters of FY25 and then maintain that earnings momentum going into FY26. Again this is my best guess, rather than a high conviction guidance.
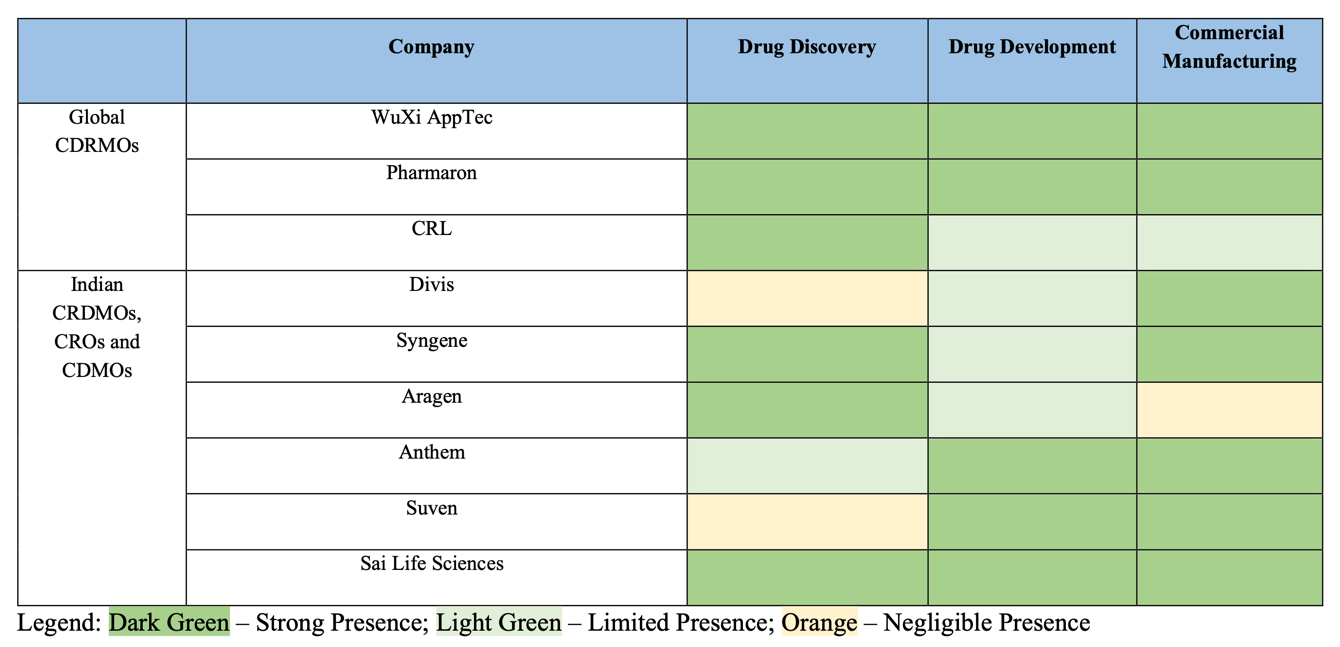
Image source: Sai Life, DRHP
Upon examining the table above, which is sourced from Sai Life’s DRHP file, my initial reaction was to question the drug development capabilities of Syngene and Divis, which are indicated as having a ‘limited presence’. Syngene is the only Indian company that developed and commercialized a novel biologic drug for the innovator, Zoetis. How can their competitor underrate such a rare capability?
Next, there was no mention of Neuland Labs, which has a demonstrated, measurable, strong moat in deuteration and peptide synthesis. (because of the stronger carbon-deuterium bonds, deuterated drugs often demonstrate superior pharmacokinetic and toxicological properties. Several clinical trials are ongoing, and a handful of deuterated drugs have received approval. Neuland Labs is proud to be an industry leader in this developing niche and is a commercial supplier of deuterated APIs).
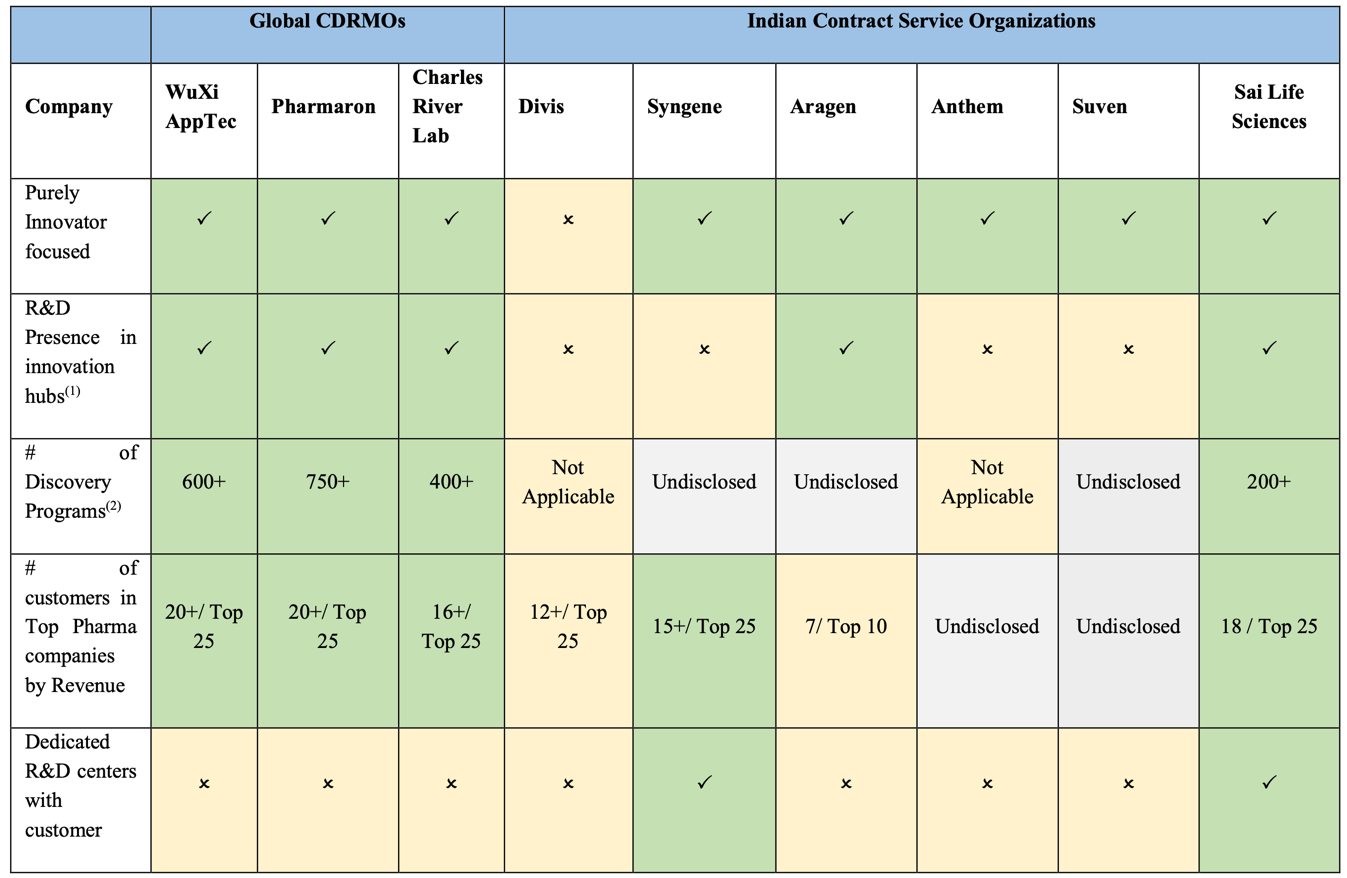
Image source: Sai Life, DRHP
Metrics such as the total number of customers or the total number of projects can be grossly misleading for investors. There are CDMO players in India, where a major pharmaceutical company has secured a deal for the development and commercial manufacturing of 15-20 molecules. The potential for full scale-up could surpass the current sales of Sai Life, which stand at approximately Rs. 1500 crores. In my opinion, this number of customers lacks significance, especially from a near term perspective.
The next consideration is the quantity of molecules in the pipeline. A single 20-step complex on-patent API could generate significantly more revenue than 10 RSM/KSM (regulated/key starting materials) molecules. Therefore, these companies should instead disclose the meaningful data points listed below:
How many KSM and RSM innovator molecules are in their space today? What is the indicative (best guess) initial 2–3-year commercial potential of these molecules with 50% failure baked in?
How many intermediate (N minus 1) innovator molecules are in their space today? What is the indicative (best guess) initial 2–3-year commercial potential of these molecules with 50% failure baked in?
How many API (final product) innovator molecules are in their space today? What is the indicative (best guess) initial 2–3-year commercial potential of these molecules with 50% failure baked in?
Predicting the future sales potential of a newly commercialized or soon-to-be-commercialized molecule is extremely challenging, as achieving commercial success after clinical success is never an easy task!
[1] Pharma Intelligence, “Clinical Development Success Rates and Contributing Factors 2011–2020”, Biotechnology Innovation Organisation, 2021 v17
[2] Part 1 – Manufacturing What Nobody Else Has Ever Done – Framework, https://indianinvestingconclave.com/recordings/160
